Tuesday 27 February 2018

11 Stats To Make Marketing Analytics More Powerful

  1. 59% of marketers rely on total lead volume as a top metric.
  2. Marketers are expected to spend over 11% of their total budget on analytics.
  3. 42% of B2B marketing professionals state that a lack of quality data is their biggest barrier to lead generation.
  4. Inbound organizations are 4 times as likely to rate their marketing strategy as effective.
  5. Just 61% of marketers believe their marketing strategy is effective.
  6. 24% of marketers don’t know whether their efforts resulted in closed-won deals.
  7. 28% of marketers say getting enough budgets is their top marketing challenge.
  8. Marketers that calculate ROI are 1.6 times more likely to receive higher budgets.
  9. 43% of marketers say proving the ROI of their marketing activities is their top marketing challenge.
  10. 72% of organizations that calculate ROI say their marketing strategy is effective.
  11. 84% of marketers cannot measure and report on the contribution of their programs to the business.

About DSIM:

Delhi School of Internet Marketing’ is a premier Digital Marketing Institute that offers an all-in-one advanced digital marketing course in Hyderabad, Bangalore, Delhi, Pune all over India. To know DSIM in detail, you can log on to its website/read DSIM reviews accessible on the web.

Wednesday 21 February 2018

6 B2B Content Marketing Tactics To Try This Year

At present, discussing B2B Marketing, the question isn’t whether it’s a practical marketing approach.

 Rather; it’s what must be done in 2018 to make it more suitable and how content marketing for B2B must change in the face of adjusted buyer expectations and keen competition.

Here are DSIM’s most loved findings, in addition to analysis on what we think they mean for the future of B2B content marketing:

1) Publishing own research

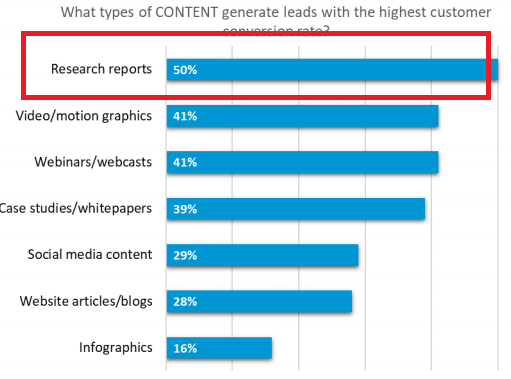
Studies say that 50 percent of B2B marketers share this belief that research reports produce leads with the highest customer conversion rates, compared to other forms of content marketing.
Conducting wide-ranging and special media marketing research isn’t an alternative, it’s a need and it should be the underlying stage of product creation.

2) Seeking Content Downloads

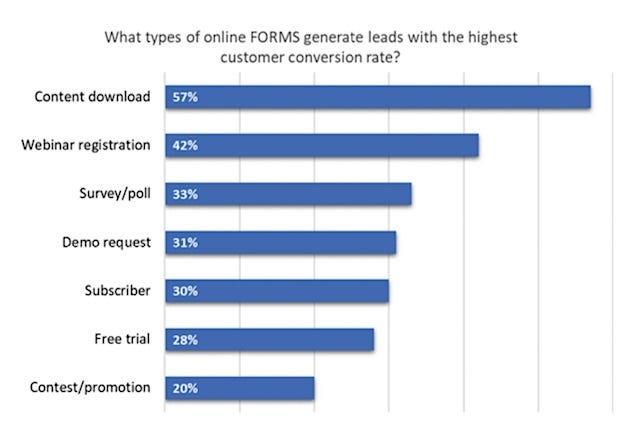
Leads with high conversion rates start with a content download.

It has been discovered that the two-thirds of B2B content marketers believe in this situation. You can compare this to webinar registration (42 percent) and demo request (31 percent) in the below-given image.

Gating your content works as when your marketing materials are left open and effortlessly accessible, it brings business contact information in exchange.

3) Credibility of the information matters

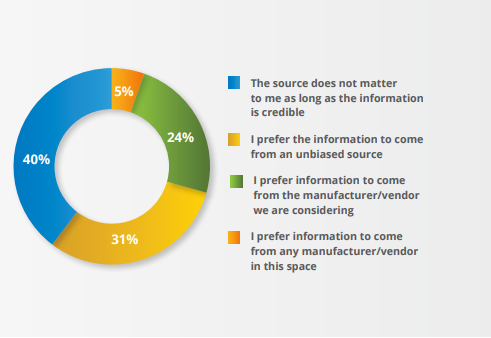
A study by Content Marketing Institute and SmartBrief says that when looking for data in regards to potential products and services in a B2B situation, forthcoming purchasers aren’t too worried about where that data comes from.

40 percent of respondents say the source of the data doesn’t make a difference, as long as it is credible.

31 percent say they prefer the info to be fair.

Curiously, 24 percent favor the data to come from the company or manufacturer that they are considering.
Individuals are searching for sound information wherever they can find it.
Vendors should make certain that their websites are up-to-date, and furthermore set aside the opportunity to analyze how their image is introduced in all channels.

4) Prioritizing content for retention

There is a requirement for content to be made and targeted openly at all stages of the funnel, including post-purchase. Here, B2B content marketers need to spend their resources suitably and must prioritize content for retention.

5) Thinking of quality, not quantity

Changes to customer outlook have extremely increased competition and social media and search engine algorithm shifts have, in mix, brought about a new content marketing world. Presently, making the authoritative piece on a picky topic is an obviously better thought than making a bunch of okay content executions across a broader topical spread.

6) Favoring multi-sensory Content Marketing

Changing consumer content consumption patterns have made written content less popular, as it got powered partially by the shift to mobile and the ability to stream video just about everywhere. This has worked in favor of multi-sensory executions like videos and interactive white papers and the like.
Companies now have begun powering B2B video and interactive content to increase reach and conversions.

About DSIM:

Delhi School of Internet Marketing’ is a premier Digital Marketing Institute that offers an all-in-one advanced digital marketing course in Hyderabad, Bangalore, Delhi, Pune all over India. To know DSIM in detail, you can log on to its website/read DSIM reviews accessible on the web.

Tuesday 20 February 2018

15 Insider Freelancing Statistics For You


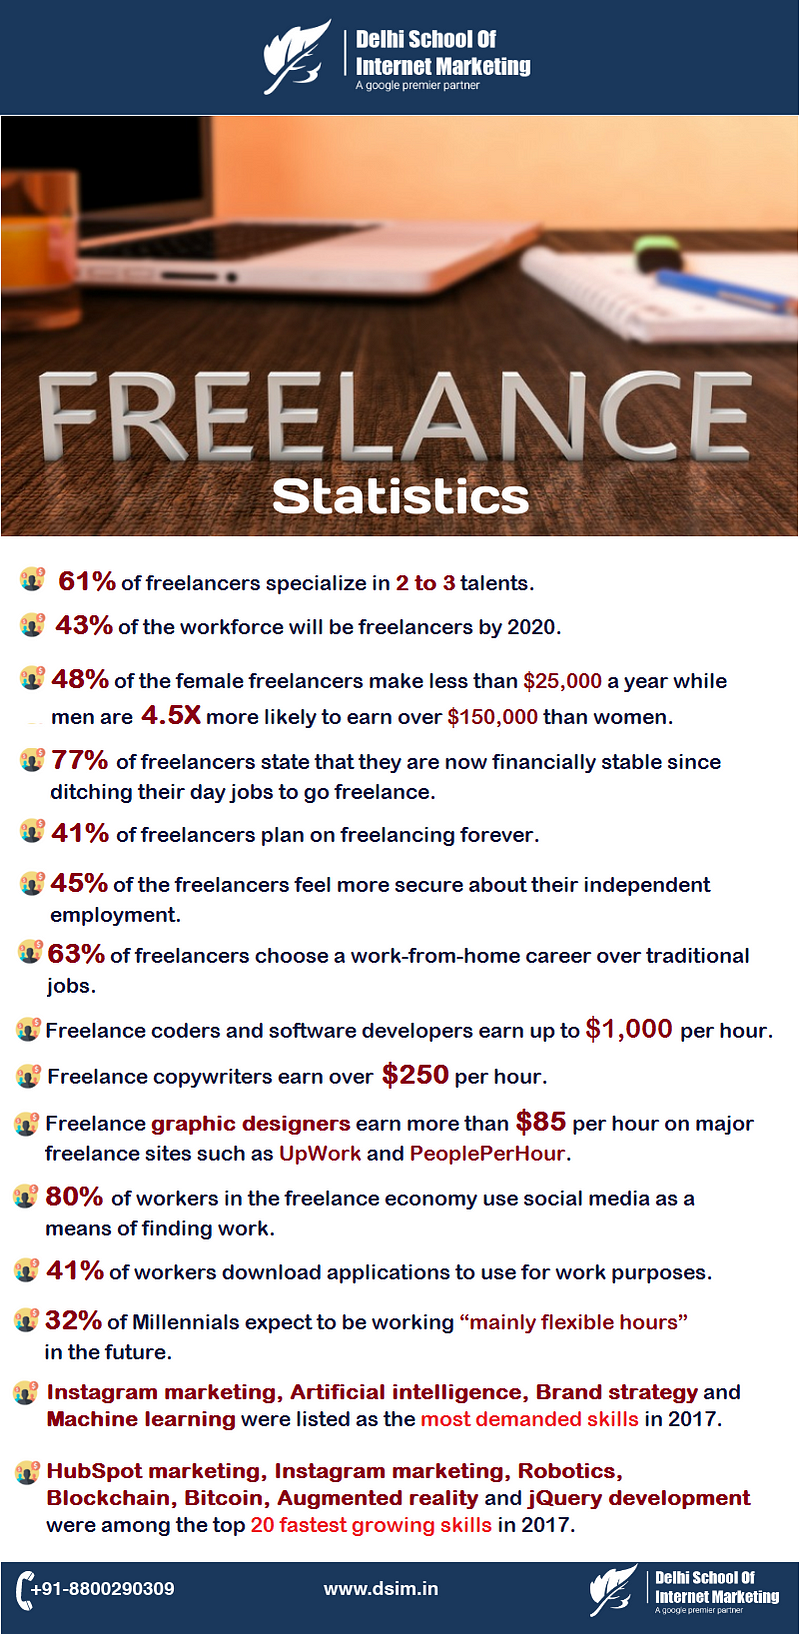
  1. 61% of freelancers specialize in 2 to 3 talents.
  2. 48% of the female freelancers make less than $25,000 a year while men are 4.5X more likely to earn over $150,000 than women.
  3. 77% of freelancers state that they are now financially stable since ditching their day jobs to go freelance.
  4. 43% of the workforce will be freelancers by 2020.
  5. 41% of freelancers plan on freelancing forever.
  6. 45% of the freelancers feel more secure about their independent employment.
  7. 63% of freelancers in the US choose a work-from-home career over traditional jobs.
  8. Freelance coders and software developers earn up to $1,000 per hour.
  9. Freelance copywriters earn over $250 per hour.
  10. Freelance graphic designers earn more than $85 per hour on major freelance sites such as UpWork and PeoplePerHour.
  11. 80% of workers in the freelance economy use social media as a means of finding work.
  12. 41% of workers download applications to use for work purposes.
  13. 32% of Millennials expect to be working “mainly flexible hours” in the future.
  14. Artificial intelligence, Instagram marketing, Machine learning, and Brand strategy were listed as the most demanded skills in 2017.
  15. Robotics, Blockchain, Bitcoin, Instagram marketing, Augmented reality, jQuery development, and HubSpot marketing were among the top 20 fastest growing skills in 2017.

About DSIM:

Delhi School of Internet Marketing’ is a premier Digital Marketing Institute that offers an all-in-one advanced digital marketing course in Hyderabad, Bangalore, Delhi, Pune all over India. To know DSIM in detail, you can log on to its website/read DSIM reviews accessible on the web.


Thursday 1 February 2018

70+ Super-useful Facebook Stats So Far This Year

facebook-stats.dsim_-e1516884033207

Talking about your favorite social media platforms???

I guess Facebook must be there….

It has become the world’s favorite social media network; having around 2.07 billion daily active users. And, is one of the best options for businesses hitting the social media market.

Here at DSIM, we love data and to prove why Facebook is so important, we’ve collected this huge list of Facebook statistics.

Let’s take a look and learn how stats can help in developing strategies to target the audienceyou want to reach on your favorite Social Media platform i.e. Facebook:

Facebook User Statistics


1) There are 2+ billion monthly active users.
2) There are 1.15 billion mobile daily active users.
3) There are 1.37 billion daily active users.
4) 47% of Facebook users only access the platform through mobile.
5) Facebook adds 500,000 new users every day; 6 new profiles every second.
6) On average, the Like and Share Buttons are viewed across almost 10 million websites daily.
7) Worldwide, 38.6% of the online population use Facebook.
8) Age 25 to 34, at 29.7% of users, is the most common age demographic.

Facebook Marketing Statistics


9) Facebook Pages posts average 2.6% organic reach.
10) Over 5 million businesses are using Facebook ads to reach their target audiences.
11) 94% of social media marketers are using the Facebook ad platform.
12) Facebook is the number one ad channel for both B2C and B2B companies.
13) 57% of consumers say social media influences their shopping, led by Facebook at 44%.
14) User-generated content has been shown to generate 6.9 times the engagement of brand-generated content.
15) Thursdays and Fridays between 1 p.m. and 3 p.m. are considered by many to be the best times to post on Facebook.
16) Brands post an average of 8 times per day on Facebook.

Facebook Advertising Statistics


17) The average click-through rate (CTR) in Facebook ads across all industries is 0.90%.
18) Images account for 75-90% of Facebook Ad performance.
19) 20% of Facebook’s mobile ad revenue comes from Instagram.
20) Facebook stated advertising revenue of $9.16 billion in the second quarter of 2017, a 47% year-over-year increase.
21) 26% of Facebook users who clicked on ads reported making a purchase.
22) The most effective length for an ad title on Facebook is four words—15 words for a link description.

Facebook Usage Statistics


23) There are an estimated 81 million fake Facebook profiles.
24) 200 million people use Facebook Lite – the app for the developing world’s slow connections.
25) Users spend an average of 20 minutes per day on the site.
26) Hive is Facebook’s data warehouse, with 300 petabytes of data.
27) Facebook generates 4 new petabytes of data per day.
28) Facebook now sees 100 million hours of daily video watch time.
29) Users generate 4 million likes every minute.
30) More than 250 billion photos have been uploaded to Facebook.

Facebook Videos Statistics


31) People are 85% more likely to buy a product after viewing a product video.
32) The number of videos appearing in Facebook’s news feed has increased 3.6 times.
33) 85% of Facebook video is watched without sound.
34) People spend 3x more time watching a Facebook Live video on average compared to a video that’s no longer live.
35) Video posts generate 135% greater organic reach compared to photos.
36) Adding captions to videos increases the watch time by 12%, on average.
37) Around 100 million hours are spent on Facebook videos every day.
38) 1 million hours of video has been watched with Samsung Gear VR.

Facebook Demographic Statistics


39) 83% of women and 75% of men use Facebook.
40) 83% of Facebook users worldwide are under the age of 45.
41) 44% of Facebook users (18 & older) are women and 56% identified as men.
42) 39% of Facebook users report being married, while another 39% report being single.

Facebook Financial Statistics


43) Net income was $4.7 billion for the third quarter of 2017.
44) Facebook’s IPO raised $16 billion, making it the third largest in U.S. history.
45) Facebook is now the 4th most valuable brand in the world with a value of $73.5billion.
46) Facebook has 23,165 employees.
47) Mark Zuckerberg’s salary is only $1 a year.

Facebook Mobile Statistics


48) In Facebook News Feed, people consume a given piece of content faster on mobile than on desktop.
49) People can recall a piece of consumed mobile content for just 0.25 seconds.
50) 19% of time spent on mobile devices occurs on Facebook.
51) 47% of Facebook users exclusively access the platform through mobile.

Facebook Connectivity Statistics


52) The average Facebook user is separated from another given user by just 3.57 degrees of separation.
53) Facebook users consider, on average, just 28% of their Facebook friends to be genuine or close friends.
54) 83% of parents with a teen between the ages of 13 and 17 are friends with their child on Facebook.
55) 39% of users say they are connected to people they have never met in person.
56) 42% of Facebook customer service responses happen during the first 60 minutes.
57) 58% say they are connected to work colleagues.
58) Facebook is available in 101 languages, and over 300,000 users helped with translation.

Facebook Messenger Statistics


59) Facebook Messenger users: 2 billion people
60) Percentage of the world’s population that use Facebook Messenger monthly: 11%
61) Number of photos sent through Facebook Messenger per month: 17 million
62) Number of chatbots on Facebook Messenger: 30,000 bots
63) Number of businesses on Facebook Messenger: 60 million
64) >89% of users access Facebook on their mobile devices and they check Facebook 14 times a day.

Facebook Live Statistics


65) “Facebook live stream” search popularity has risen over 330% since Facebook Live’s rollout.
66) Facebook paid $2.2 million to influencers using Facebook Live.
67) Facebook Live videos are watched 3x longer than videos that aren’t live anymore.
68) Users comment on Facebook Live videos at 10x the rate of regular videos.
69) New Year’s Eve 2016 was Facebook Live’s biggest night yet.
70) Daily watch time for Facebook Live broadcasts has grown by more than 4X.
71) 1 in every 5 Facebook videos is a live broadcast.

About DSIM:

Delhi School of Internet Marketing’ is a premier Digital Marketing Institute that offers an all-in-one advanced digital marketing course in Hyderabad, Bangalore, Delhi, Pune all over India. To know DSIM in detail, you can log on to its website/read DSIM reviews accessible on the web.

Source: http://dsim.in/blog/2018/01/25/70-super-useful-facebook-stats-far-year/